Explore, download and share
THE STORY BEHIND THE CHART
The story behind the numbers
Forest area shares reflect geography, land use and management. They do not distinguish every type of forest or directly measure ecosystem quality. Changes over time should be read with the source definition and the distinction between natural forest and planted forest in mind.
THE TAKEAWAY
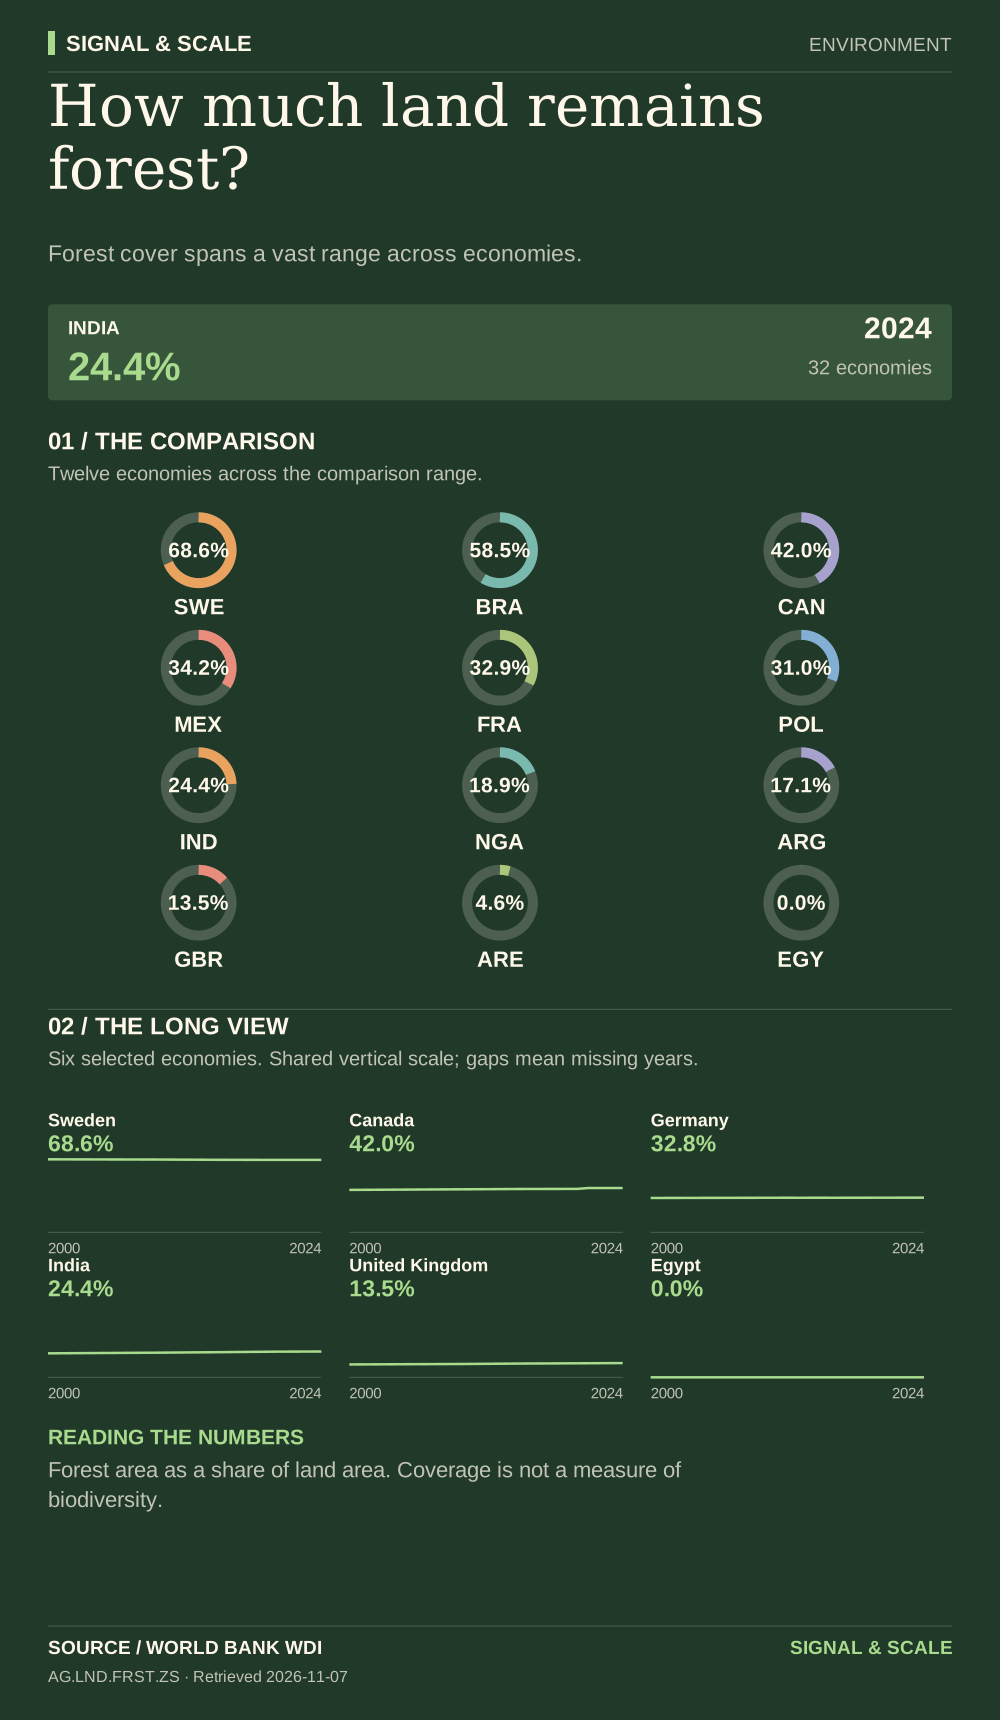
Forest cover spans a vast range across economies.
Read the numbers carefully
Forest area as a share of land area. Coverage is not a measure of biodiversity.
Data behind the visual
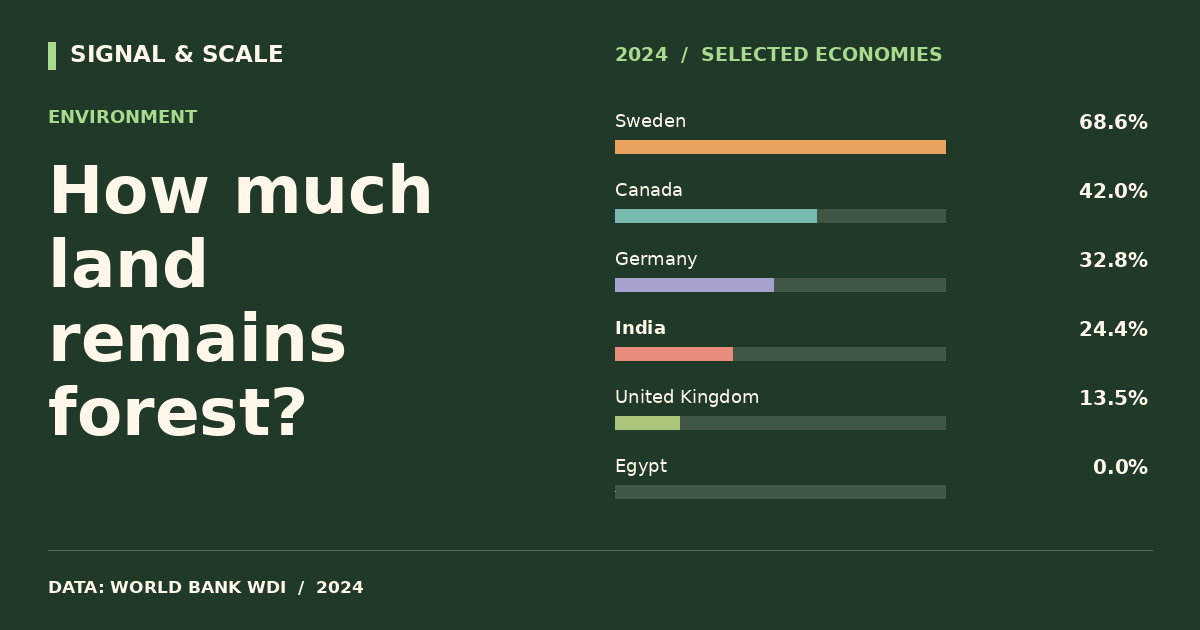
This selected comparison includes 32 economies with observations in 2024 shown in % of land.
| Country | Value |
|---|---|
| Sweden | 68.6% |
| Japan | 68.3% |
| South Korea | 64.4% |
| Brazil | 58.5% |
| Indonesia | 50.7% |
| Vietnam | 47.1% |
| Canada | 42% |
| Thailand | 38.7% |
| Mexico | 34.2% |
| United States | 33.8% |
| Norway | 33.2% |
| France | 32.9% |
| Germany | 32.8% |
| Italy | 31.8% |
| Poland | 31% |
| Türkiye | 29.5% |
| Philippines | 24.8% |
| India | 24.4% |
| China | 24% |
| Ethiopia | 23.8% |
| Nigeria | 18.9% |
| South Africa | 18.8% |
| Australia | 17.4% |
| Argentina | 17.1% |
| Bangladesh | 14.4% |
| United Kingdom | 13.5% |
| Netherlands | 11% |
| Kenya | 6.6% |
| United Arab Emirates | 4.6% |
| Pakistan | 4.1% |
| Saudi Arabia | 1.3% |
| Egypt | 0% |
EXPLORE THE DATA
Compare any two countries.
Choose two places to inspect this indicator side-by-side. Same source, same year.
VS