← All visual stories
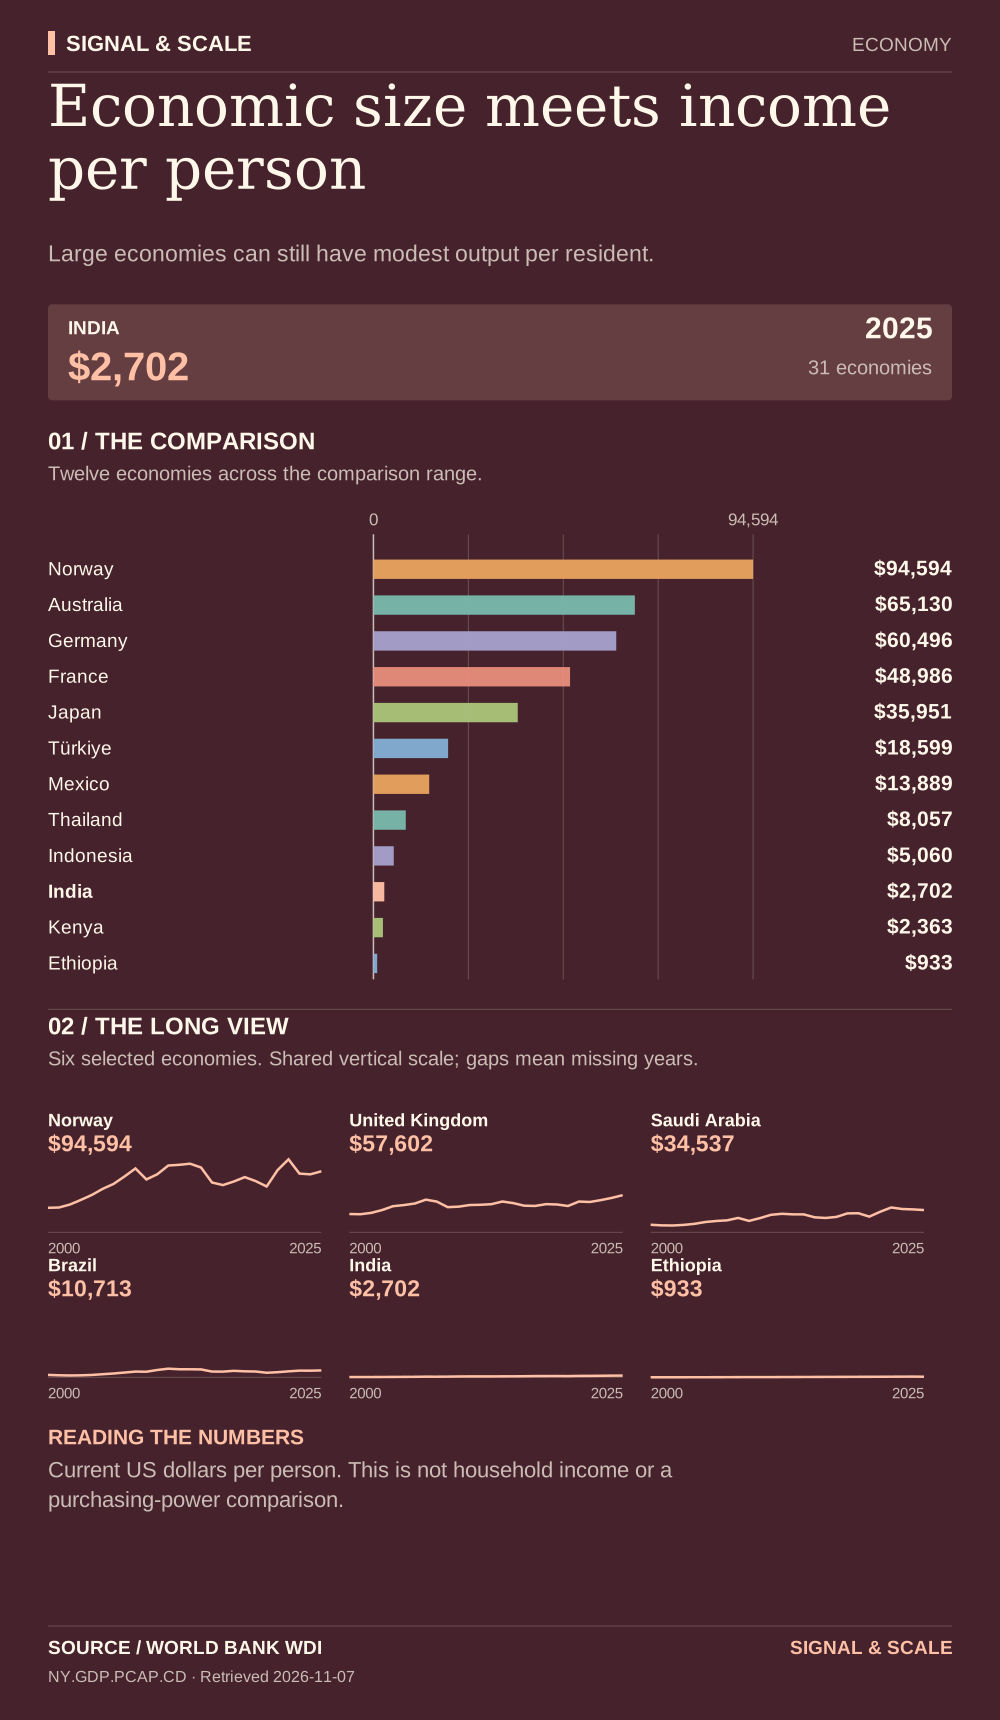
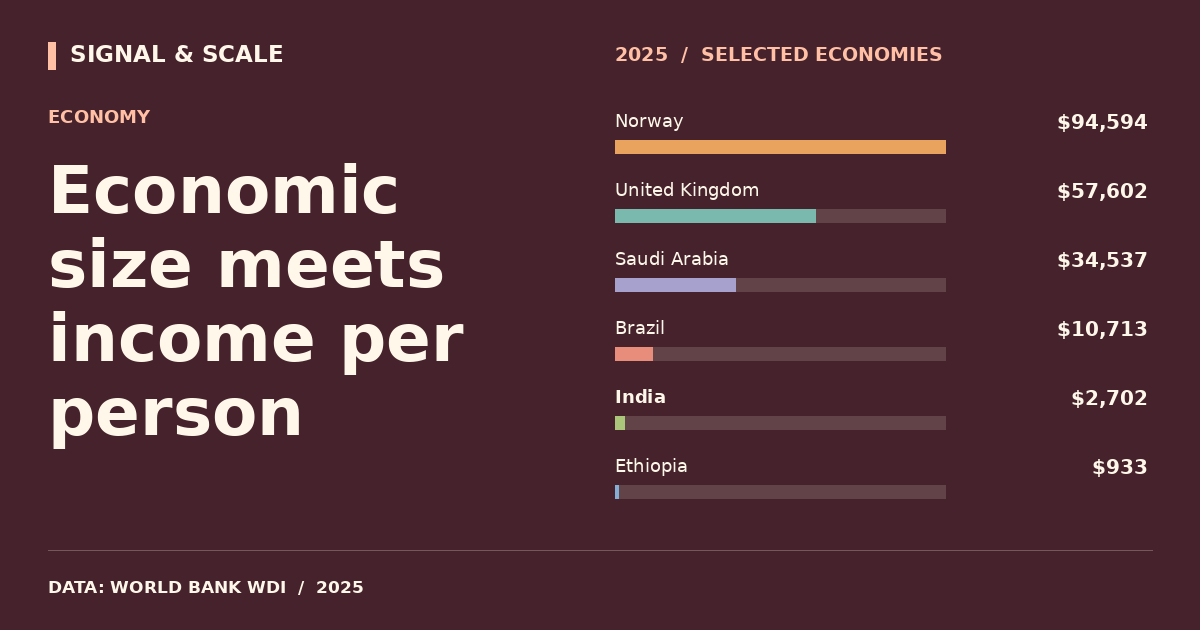
Economic size meets income per person
Large economies can still have modest output per resident.

Explore, download and share
THE STORY BEHIND THE CHART
The story behind the numbers
GDP per person divides nominal output by population. It helps explain why an economy can be large in aggregate while its average output per resident remains much lower than that of smaller, richer countries. Exchange rates affect this comparison, and national averages conceal internal inequality.
THE TAKEAWAY
Large economies can still have modest output per resident.
Read the numbers carefully
Current US dollars per person. This is not household income or a purchasing-power comparison.
Data behind the visual
This selected comparison includes 31 economies with observations in 2025 shown in USD per person.
| Country | Value |
|---|---|
| Norway | $94,594 |
| United States | $90,027 |
| Netherlands | $73,684 |
| Australia | $65,130 |
| Sweden | $63,133 |
| Germany | $60,496 |
| United Kingdom | $57,602 |
| Canada | $55,698 |
| France | $48,986 |
| Italy | $43,309 |
| South Korea | $36,227 |
| Japan | $35,951 |
| Saudi Arabia | $34,537 |
| Poland | $28,420 |
| Türkiye | $18,599 |
| Argentina | $14,898 |
| Mexico | $13,889 |
| China | $13,862 |
| Brazil | $10,713 |
| Thailand | $8,057 |
| South Africa | $6,598 |
| Vietnam | $5,066 |
| Indonesia | $5,060 |
| Philippines | $4,171 |
| Egypt | $3,086 |
| India | $2,702 |
| Bangladesh | $2,597 |
| Kenya | $2,363 |
| Pakistan | $1,596 |
| Nigeria | $1,224 |
| Ethiopia | $933 |
EXPLORE THE DATA
Compare any two countries.
Choose two places to inspect this indicator side-by-side. Same source, same year.
VS