Explore, download and share
THE STORY BEHIND THE CHART
The story behind the numbers
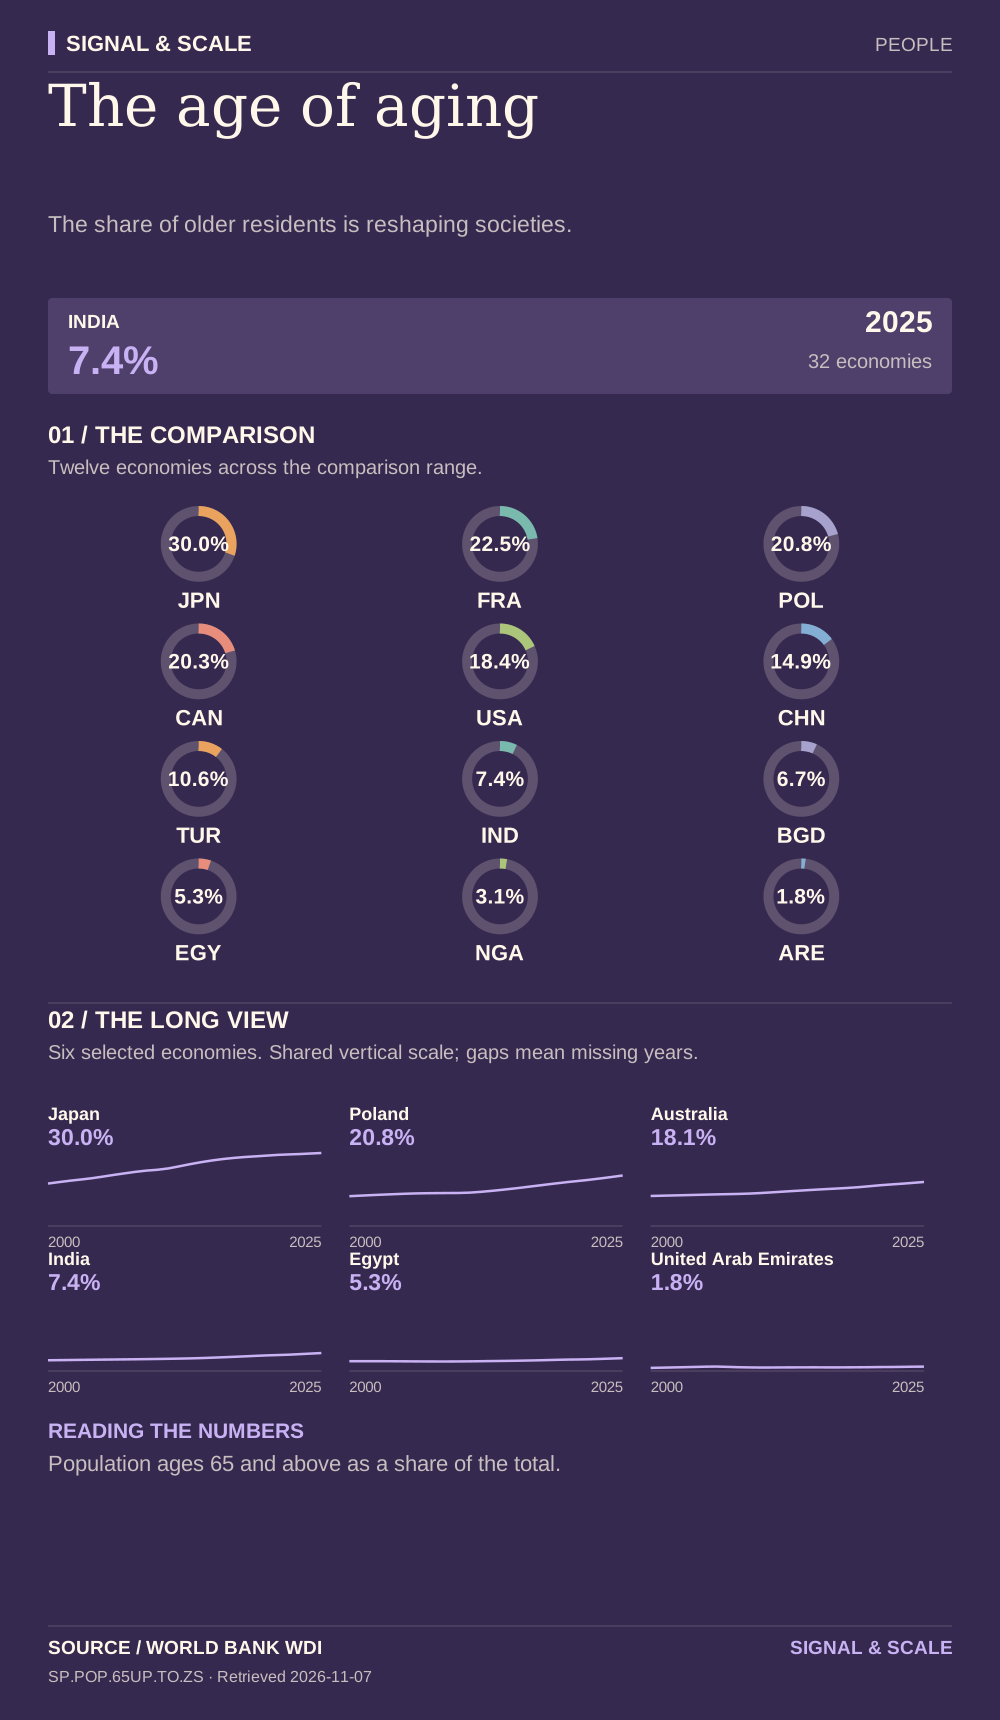
The population aged 65 and over affects demand for care, retirement systems and accessible infrastructure. The share changes through fertility, survival and migration. A high older-age share is a demographic fact rather than a direct measure of economic dependency.
THE TAKEAWAY
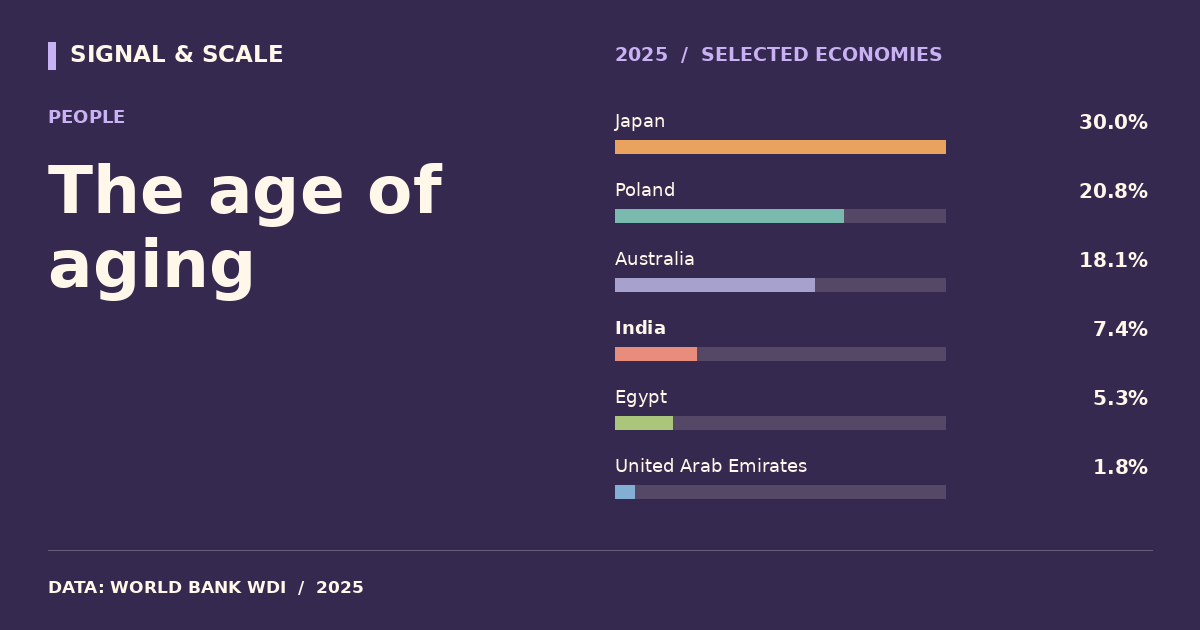
The share of older residents is reshaping societies.
Read the numbers carefully
Population ages 65 and above as a share of the total.
Data behind the visual
This selected comparison includes 32 economies with observations in 2025 shown in % of people.
| Country | Value |
|---|---|
| Japan | 30% |
| Italy | 25.1% |
| Germany | 23.7% |
| France | 22.5% |
| Sweden | 20.9% |
| Netherlands | 20.9% |
| Poland | 20.8% |
| South Korea | 20.3% |
| Canada | 20.3% |
| United Kingdom | 19.7% |
| Norway | 19.1% |
| United States | 18.4% |
| Australia | 18.1% |
| Thailand | 16% |
| China | 14.9% |
| Argentina | 12.6% |
| Brazil | 11.5% |
| Türkiye | 10.6% |
| Vietnam | 9.5% |
| Mexico | 8.5% |
| Indonesia | 7.5% |
| India | 7.4% |
| South Africa | 6.9% |
| Bangladesh | 6.7% |
| Philippines | 5.7% |
| Egypt | 5.3% |
| Pakistan | 4.4% |
| Ethiopia | 3.3% |
| Nigeria | 3.1% |
| Saudi Arabia | 3.1% |
| Kenya | 3% |
| United Arab Emirates | 1.8% |
EXPLORE THE DATA
Compare any two countries.
Choose two places to inspect this indicator side-by-side. Same source, same year.
VS