← All visual stories
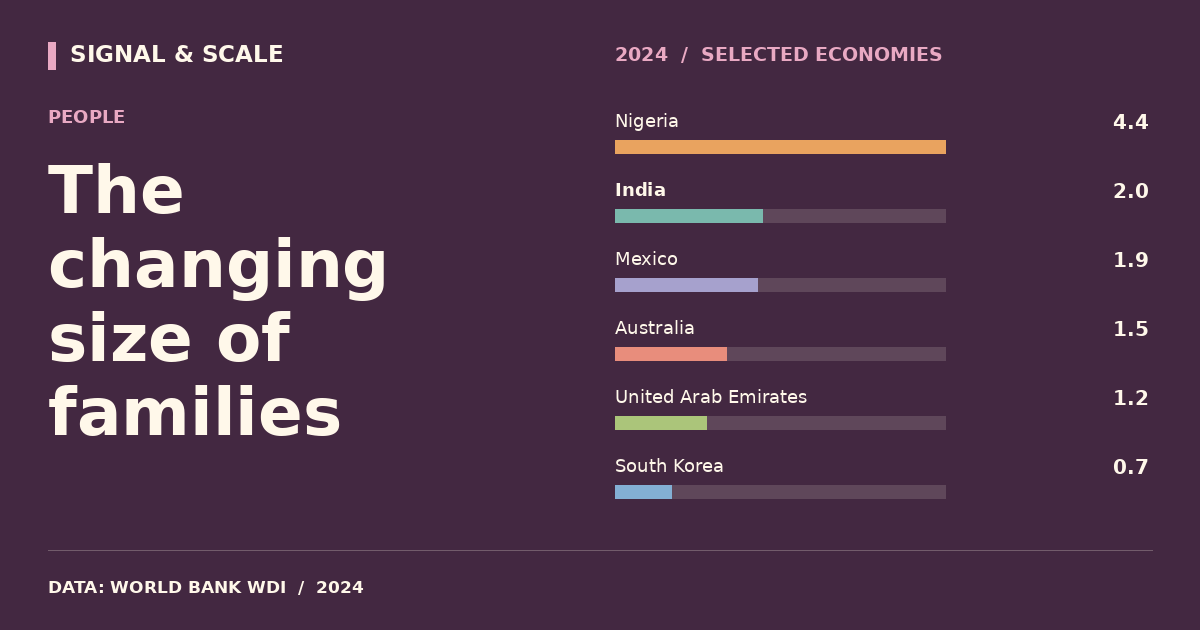
The changing size of families
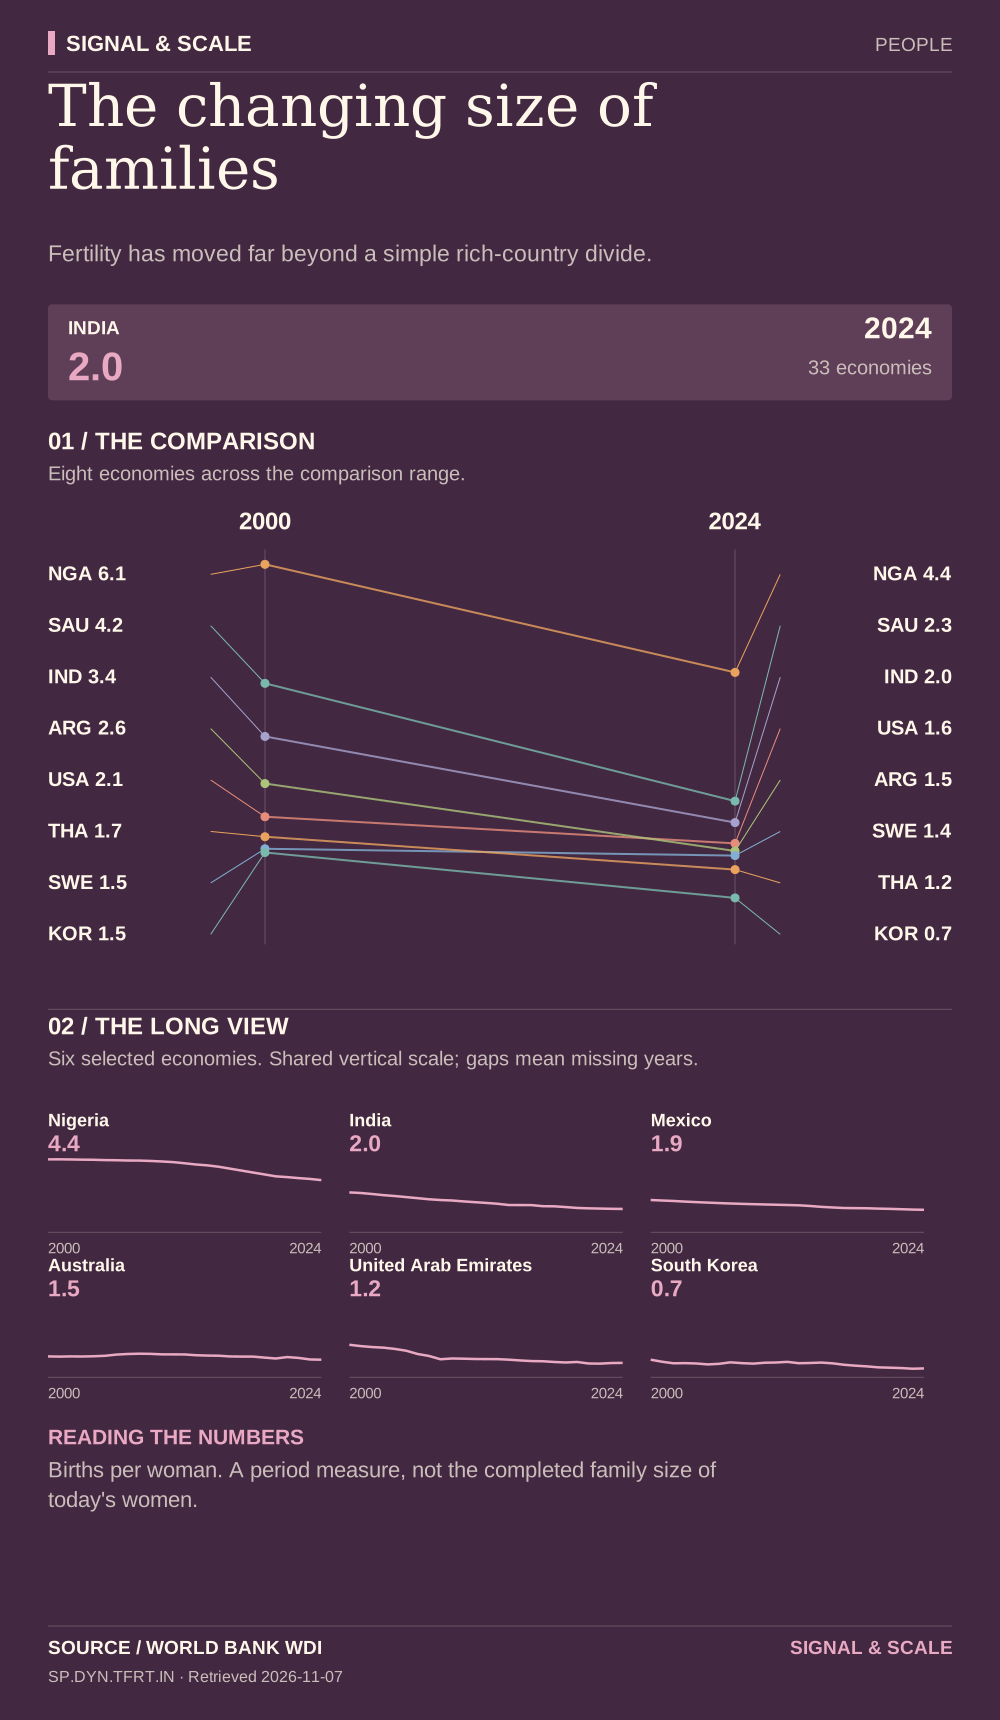
Fertility has moved far beyond a simple rich-country divide.

Explore, download and share
THE STORY BEHIND THE CHART
The story behind the numbers
Total fertility estimates the births a woman would have over her life if current age-specific fertility rates persisted. The comparison of two years shows the direction and scale of the transition. Replacement fertility is approximately 2.1 in low-mortality populations, with variation across settings.
THE TAKEAWAY
Fertility has moved far beyond a simple rich-country divide.
Read the numbers carefully
Births per woman. A period measure, not the completed family size of today's women.
Data behind the visual
This selected comparison includes 33 economies with observations in 2024 shown in births per woman.
| Country | Value |
|---|---|
| Nigeria | 4.4 |
| Ethiopia | 3.9 |
| Pakistan | 3.5 |
| Kenya | 3.2 |
| Egypt | 2.7 |
| Saudi Arabia | 2.3 |
| South Africa | 2.2 |
| Bangladesh | 2.1 |
| Indonesia | 2.1 |
| India | 2 |
| Nepal | 2 |
| Vietnam | 1.9 |
| Philippines | 1.9 |
| Mexico | 1.9 |
| United States | 1.6 |
| Brazil | 1.6 |
| France | 1.6 |
| United Kingdom | 1.6 |
| Argentina | 1.5 |
| Australia | 1.5 |
| Türkiye | 1.5 |
| Norway | 1.4 |
| Netherlands | 1.4 |
| Sweden | 1.4 |
| Germany | 1.4 |
| Canada | 1.2 |
| United Arab Emirates | 1.2 |
| Thailand | 1.2 |
| Italy | 1.2 |
| Japan | 1.1 |
| Poland | 1.1 |
| China | 1 |
| South Korea | 0.7 |
EXPLORE THE DATA
Compare any two countries.
Choose two places to inspect this indicator side-by-side. Same source, same year.
VS