← All visual stories
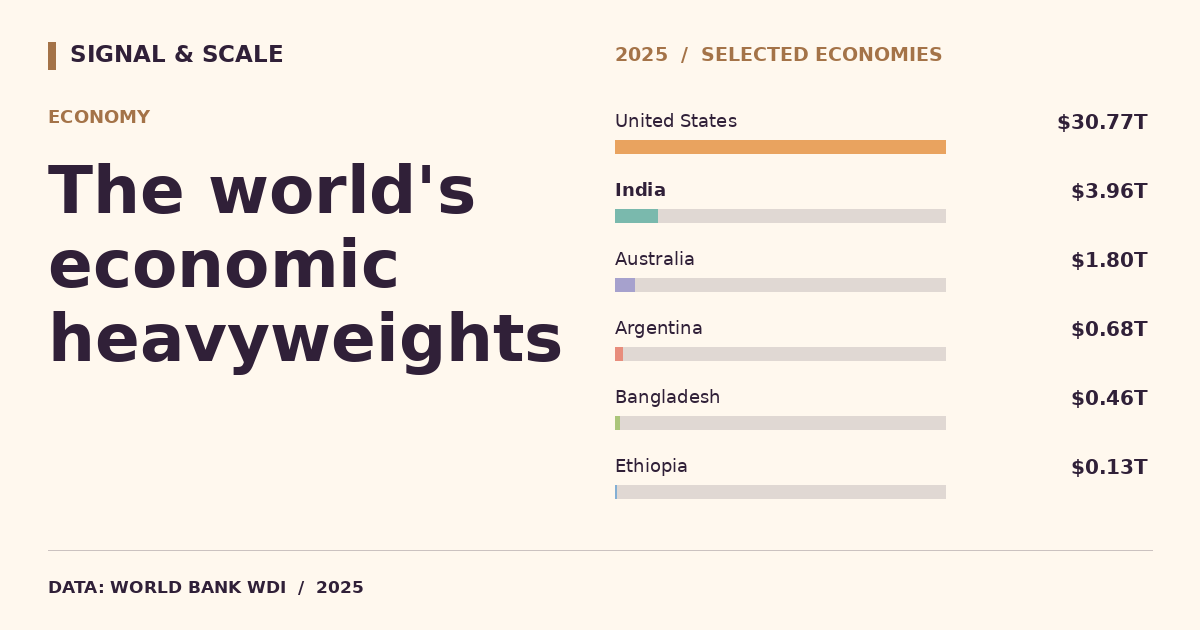
The world's economic heavyweights
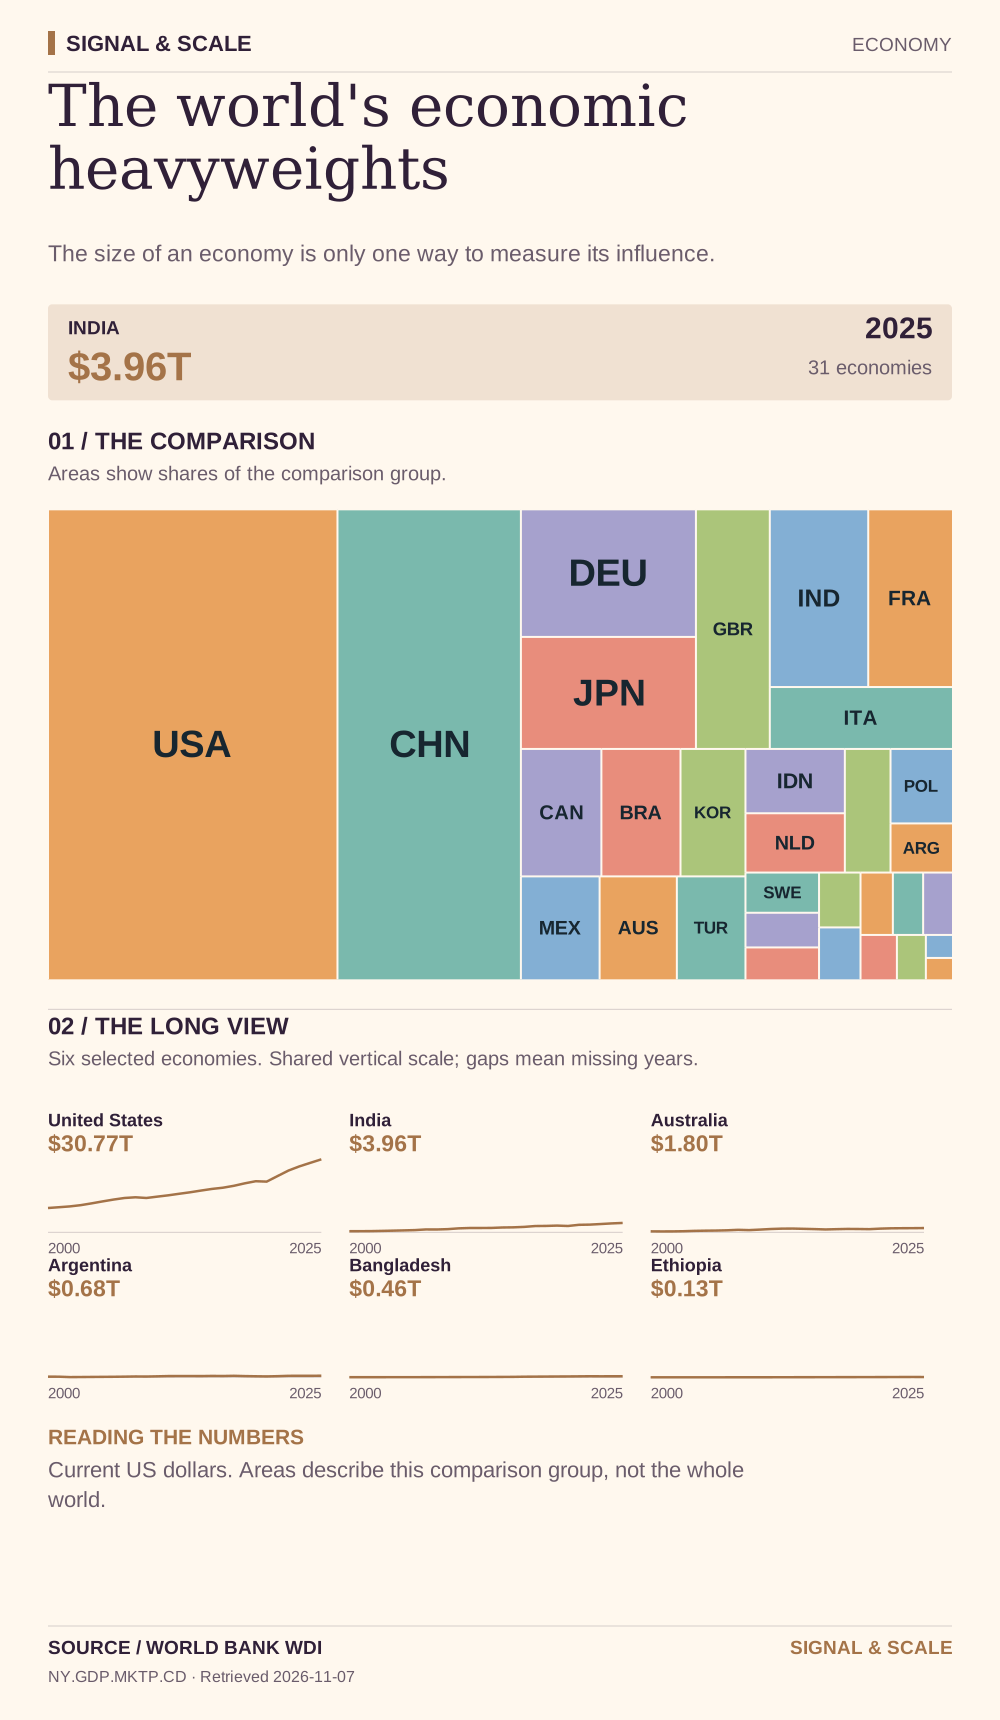
The size of an economy is only one way to measure its influence.

Explore, download and share
THE STORY BEHIND THE CHART
The story behind the numbers
Nominal GDP combines domestic production with the effect of exchange rates. The area comparison shows how output is distributed across the selected economies. The historical lines reveal how that balance has shifted since 2000. A rising dollar value can reflect inflation or currency appreciation as well as greater production.
THE TAKEAWAY
The size of an economy is only one way to measure its influence.
Read the numbers carefully
Current US dollars. Areas describe this comparison group, not the whole world.
Data behind the visual
This selected comparison includes 31 economies with observations in 2025 shown in USD trillion.
| Country | Value |
|---|---|
| United States | $30.77T |
| China | $19.5T |
| Germany | $5.05T |
| Japan | $4.44T |
| United Kingdom | $4T |
| India | $3.96T |
| France | $3.37T |
| Italy | $2.55T |
| Canada | $2.32T |
| Brazil | $2.28T |
| South Korea | $1.87T |
| Mexico | $1.83T |
| Australia | $1.8T |
| Türkiye | $1.6T |
| Indonesia | $1.45T |
| Netherlands | $1.33T |
| Saudi Arabia | $1.28T |
| Poland | $1.04T |
| Argentina | $0.68T |
| Sweden | $0.67T |
| Thailand | $0.58T |
| Norway | $0.53T |
| Vietnam | $0.51T |
| Philippines | $0.49T |
| Bangladesh | $0.46T |
| South Africa | $0.43T |
| Pakistan | $0.41T |
| Egypt | $0.37T |
| Nigeria | $0.29T |
| Kenya | $0.14T |
| Ethiopia | $0.13T |
EXPLORE THE DATA
Compare any two countries.
Choose two places to inspect this indicator side-by-side. Same source, same year.
VS