← All visual stories
The uneven pressure of rising prices
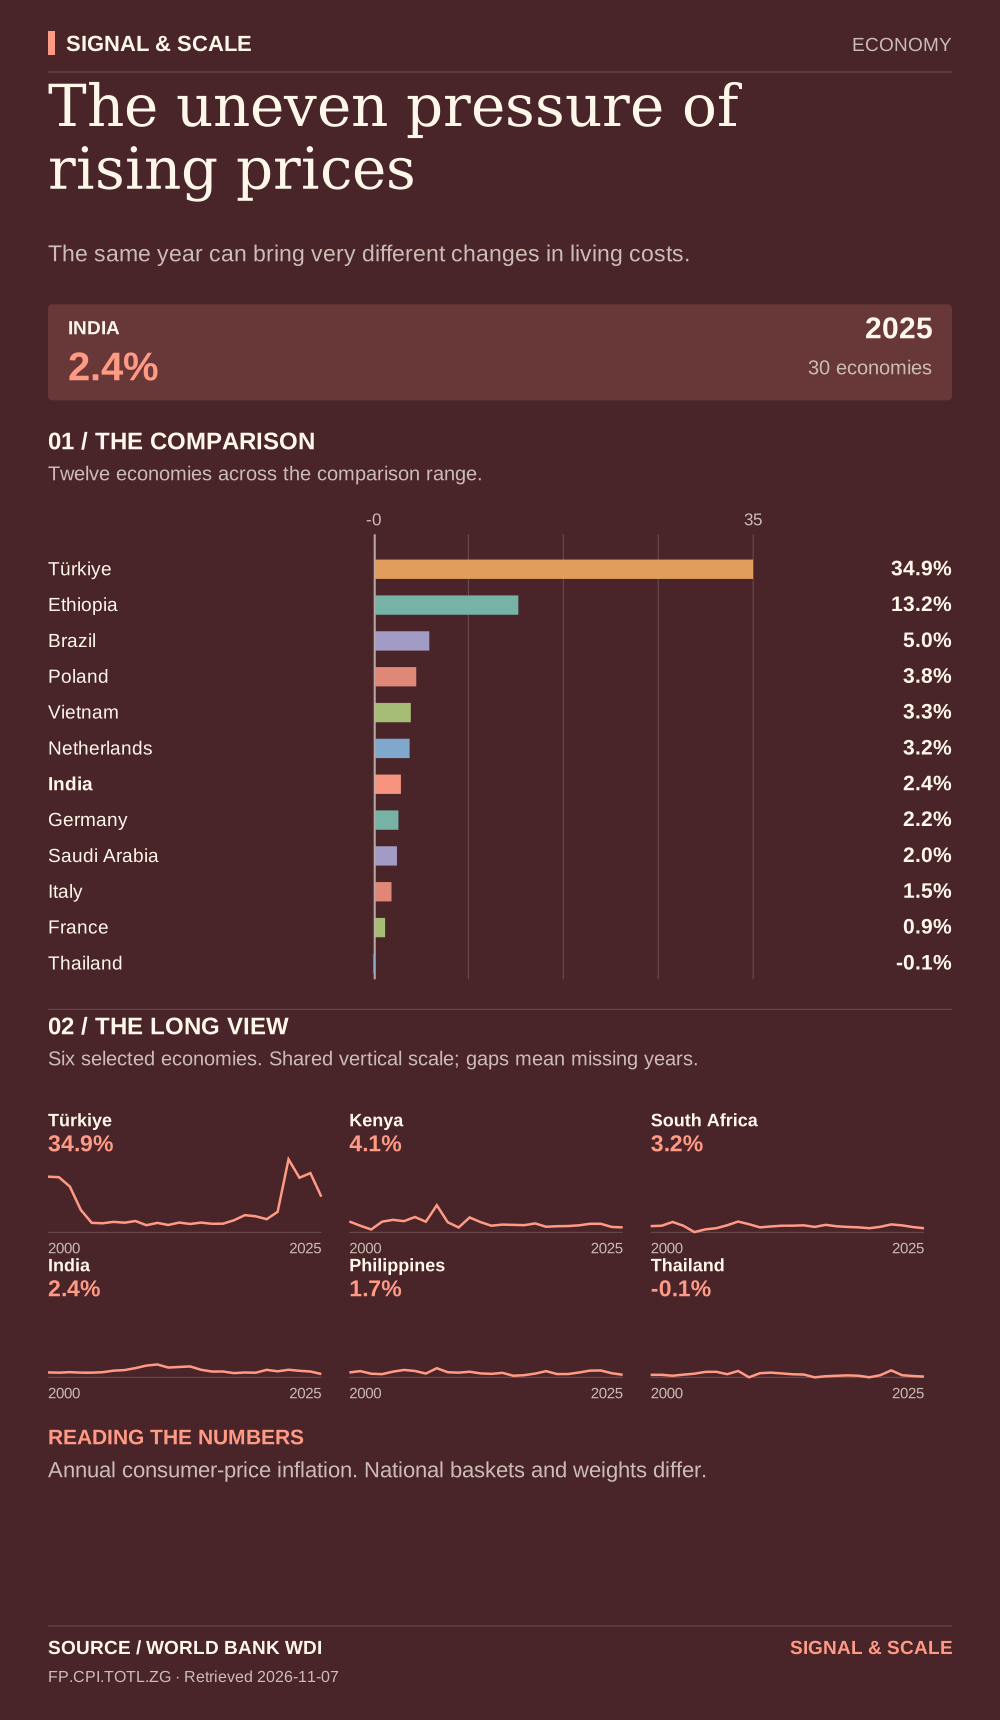
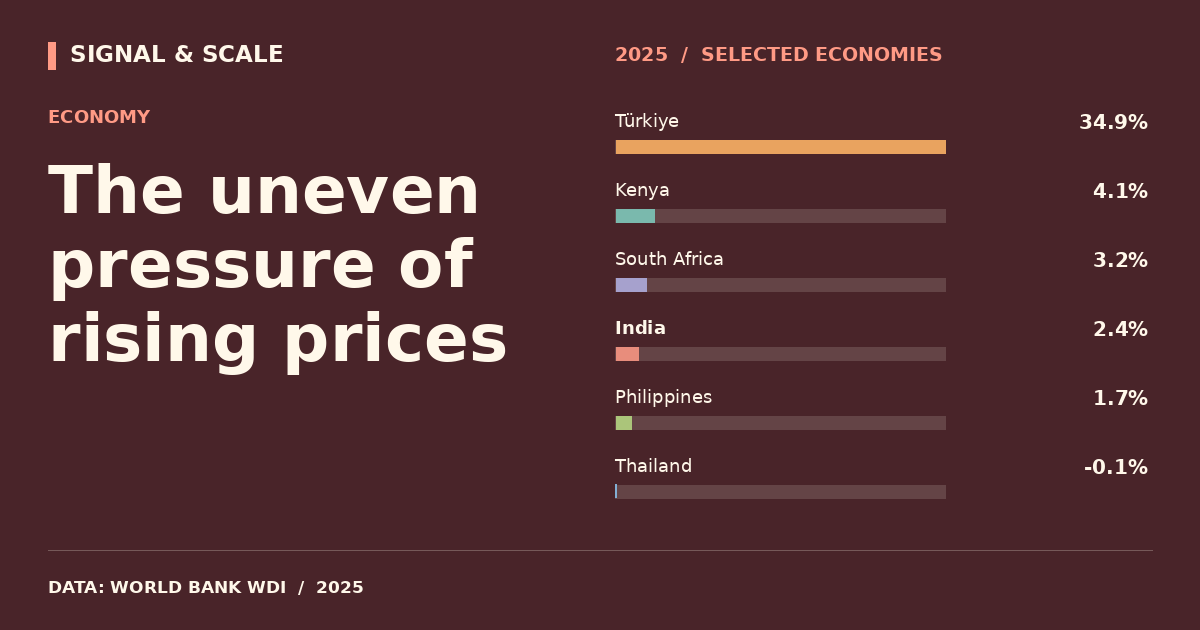
The same year can bring very different changes in living costs.

Explore, download and share
THE STORY BEHIND THE CHART
The story behind the numbers
Consumer-price inflation describes how quickly a representative basket becomes more expensive. Negative readings indicate falling average prices. Household experience can differ substantially because spending patterns vary, especially for food, housing and energy.
THE TAKEAWAY
The same year can bring very different changes in living costs.
Read the numbers carefully
Annual consumer-price inflation. National baskets and weights differ.
Data behind the visual
This selected comparison includes 30 economies with observations in 2025 shown in % annual.
| Country | Value |
|---|---|
| Türkiye | 34.9% |
| Nigeria | 23% |
| Egypt | 14.1% |
| Ethiopia | 13.2% |
| Bangladesh | 8.8% |
| Brazil | 5% |
| Kenya | 4.1% |
| United Kingdom | 3.9% |
| Poland | 3.8% |
| Mexico | 3.8% |
| Pakistan | 3.5% |
| Vietnam | 3.3% |
| South Africa | 3.2% |
| Netherlands | 3.2% |
| Japan | 3.2% |
| Norway | 3% |
| Australia | 2.9% |
| India | 2.4% |
| Germany | 2.2% |
| South Korea | 2.1% |
| Canada | 2.1% |
| Saudi Arabia | 2% |
| Indonesia | 1.9% |
| Philippines | 1.7% |
| Italy | 1.5% |
| United Arab Emirates | 1.3% |
| France | 0.9% |
| Sweden | 0.7% |
| China | 0.1% |
| Thailand | -0.1% |
EXPLORE THE DATA
Compare any two countries.
Choose two places to inspect this indicator side-by-side. Same source, same year.
VS