← All visual stories
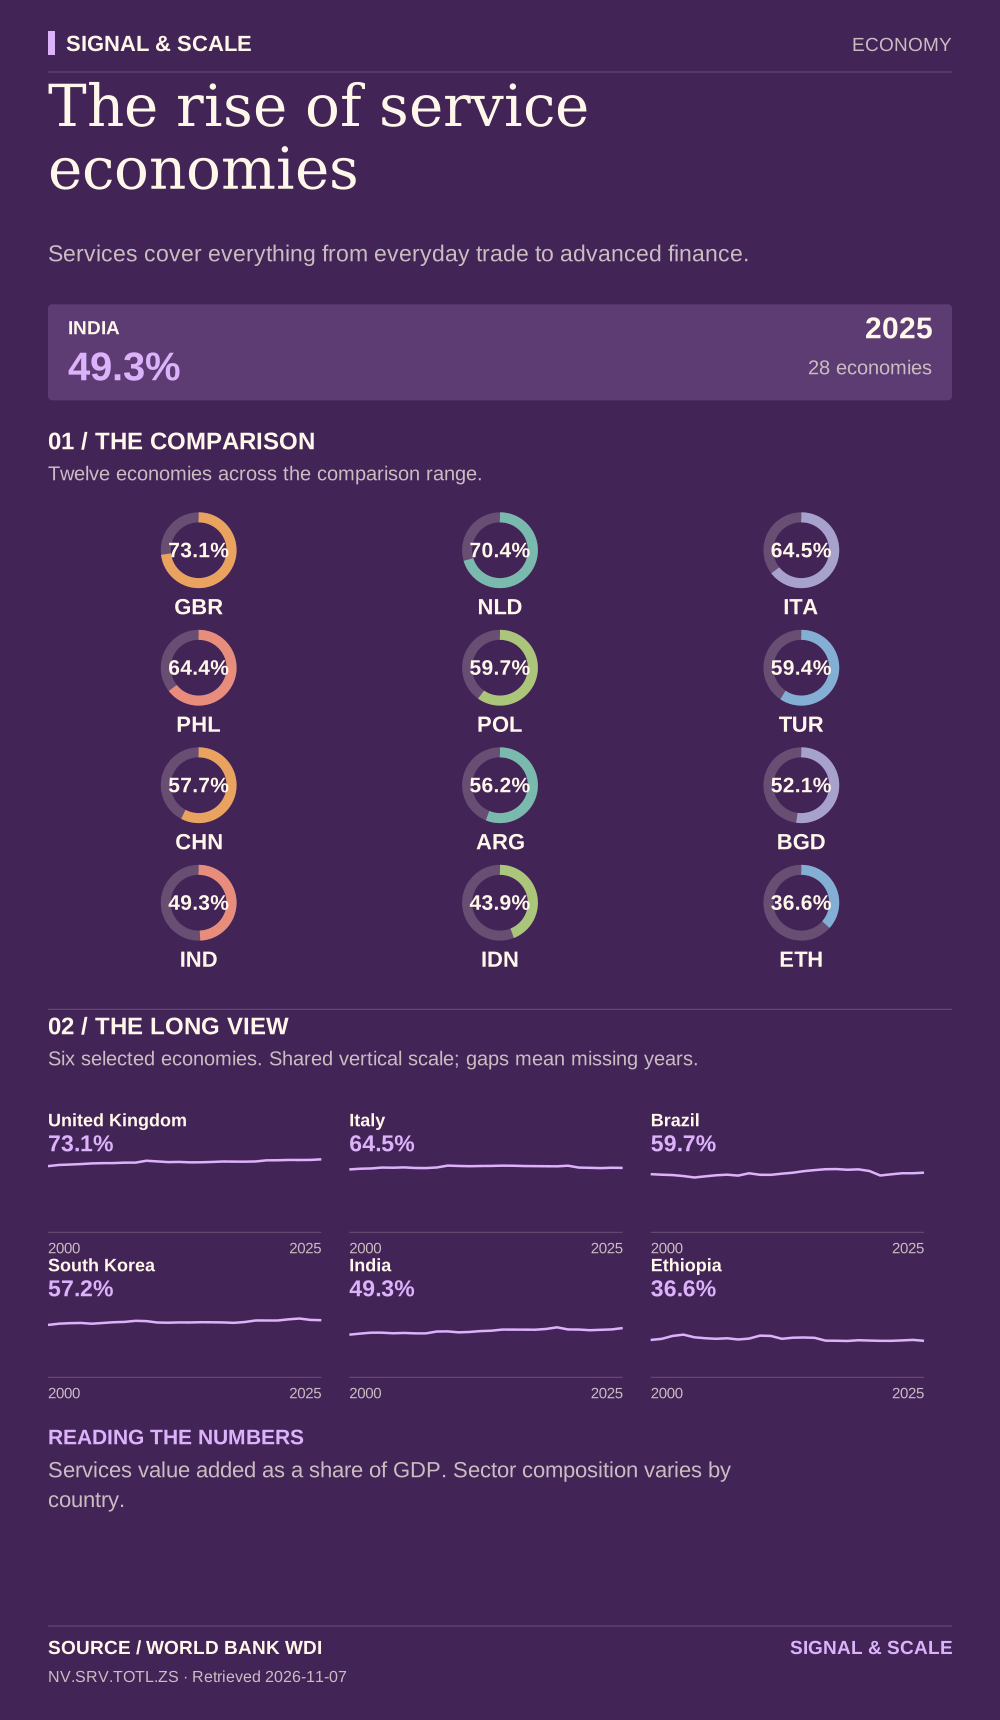
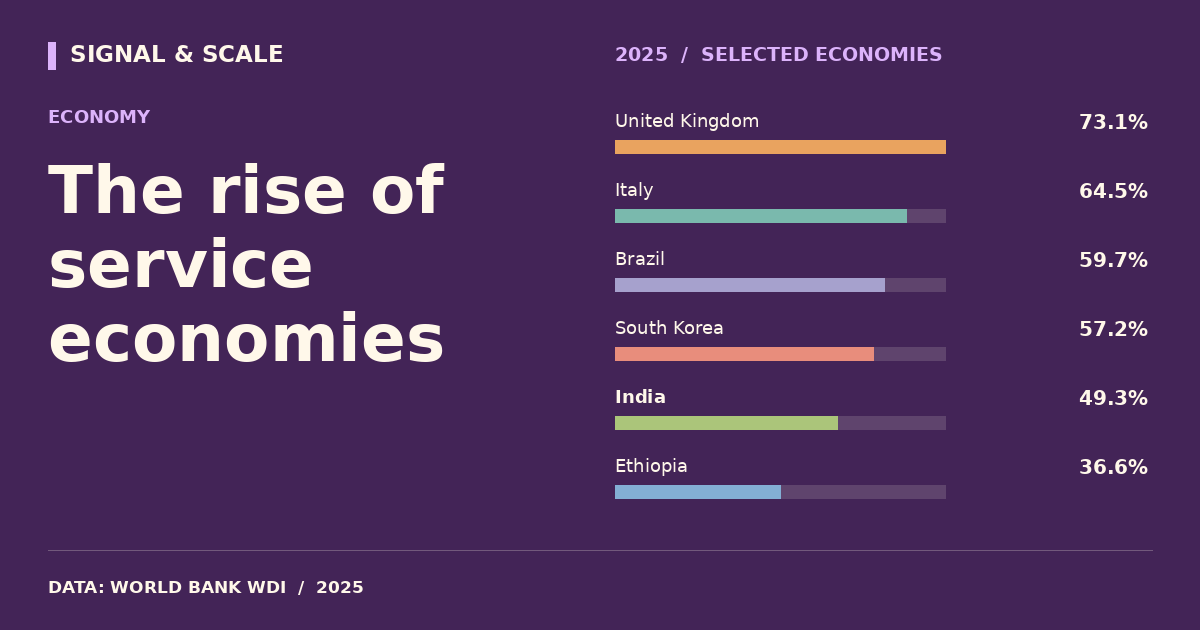
The rise of service economies
Services cover everything from everyday trade to advanced finance.

Explore, download and share
THE STORY BEHIND THE CHART
The story behind the numbers
Services include a broad set of activities with very different productivity and pay. A large share may describe a sophisticated knowledge economy, a tourism hub or a large informal service sector. The historical comparison shows structural change without assuming a single development path.
THE TAKEAWAY
Services cover everything from everyday trade to advanced finance.
Read the numbers carefully
Services value added as a share of GDP. Sector composition varies by country.
Data behind the visual
This selected comparison includes 28 economies with observations in 2025 shown in % of GDP.
| Country | Value |
|---|---|
| United Kingdom | 73.1% |
| France | 70.9% |
| Netherlands | 70.4% |
| Australia | 67.5% |
| Sweden | 67% |
| Italy | 64.5% |
| Germany | 64.5% |
| Philippines | 64.4% |
| South Africa | 63.1% |
| Thailand | 60.2% |
| Poland | 59.7% |
| Brazil | 59.7% |
| Türkiye | 59.4% |
| Mexico | 58.9% |
| Nigeria | 58.2% |
| China | 57.7% |
| South Korea | 57.2% |
| Argentina | 56.2% |
| Kenya | 55.1% |
| Norway | 55% |
| Bangladesh | 52.1% |
| Pakistan | 50.9% |
| India | 49.3% |
| Saudi Arabia | 48.9% |
| Egypt | 47.3% |
| Indonesia | 43.9% |
| Vietnam | 42.7% |
| Ethiopia | 36.6% |
EXPLORE THE DATA
Compare any two countries.
Choose two places to inspect this indicator side-by-side. Same source, same year.
VS