Explore, download and share
THE STORY BEHIND THE CHART
The story behind the numbers
Exports plus imports can exceed GDP, particularly in smaller economies and trading hubs. The ratio captures exposure to international trade rather than the domestic value added by exports. Geography, production networks and economic size all influence the comparison.
THE TAKEAWAY
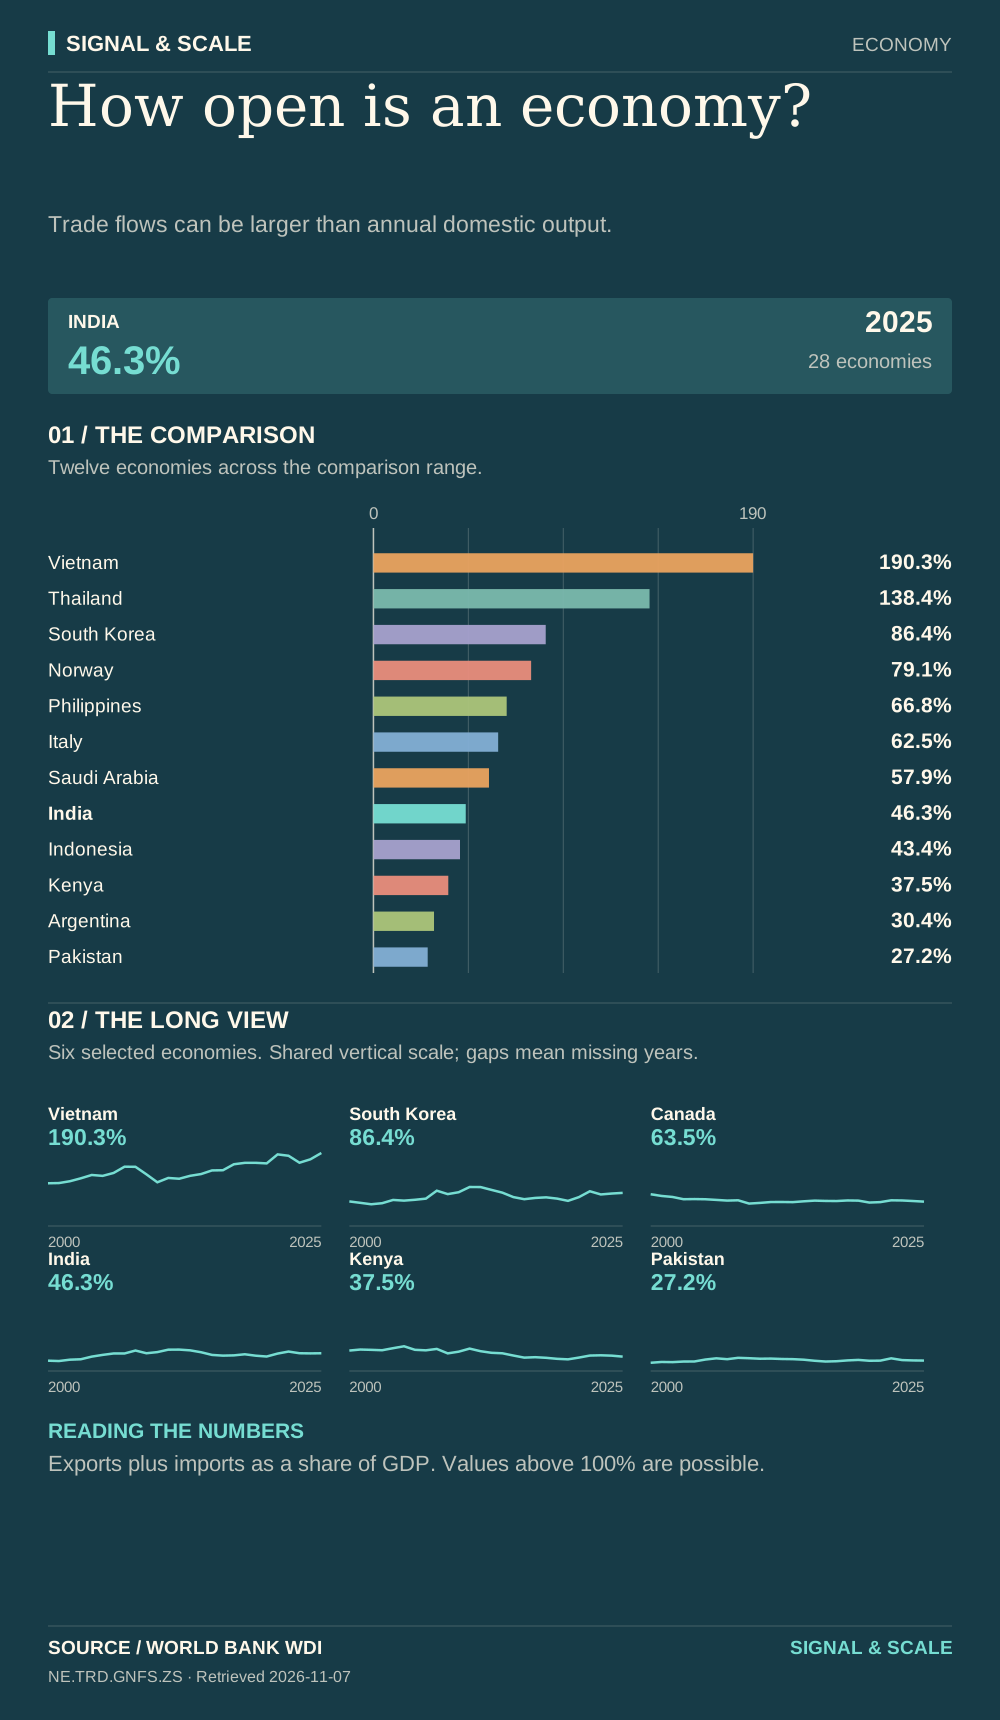
Trade flows can be larger than annual domestic output.
Read the numbers carefully
Exports plus imports as a share of GDP. Values above 100% are possible.
Data behind the visual
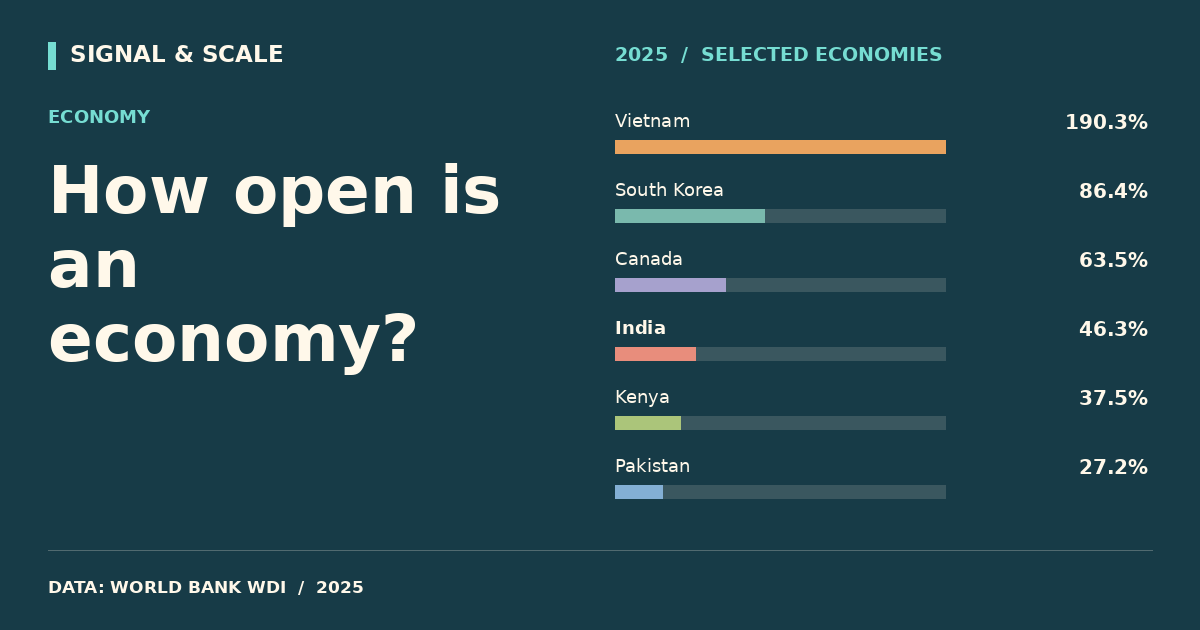
This selected comparison includes 28 economies with observations in 2025 shown in % of GDP.
| Country | Value |
|---|---|
| Vietnam | 190.3% |
| Netherlands | 150.1% |
| Thailand | 138.4% |
| Sweden | 104.3% |
| Poland | 97% |
| South Korea | 86.4% |
| Mexico | 79.9% |
| Norway | 79.1% |
| Germany | 78.5% |
| France | 67.2% |
| Philippines | 66.8% |
| Canada | 63.5% |
| Italy | 62.5% |
| United Kingdom | 62.5% |
| South Africa | 60.9% |
| Saudi Arabia | 57.9% |
| Egypt | 51.3% |
| Türkiye | 49.9% |
| India | 46.3% |
| Australia | 45.9% |
| Indonesia | 43.4% |
| China | 38% |
| Kenya | 37.5% |
| Brazil | 35.3% |
| Ethiopia | 33.5% |
| Argentina | 30.4% |
| Bangladesh | 28% |
| Pakistan | 27.2% |
EXPLORE THE DATA
Compare any two countries.
Choose two places to inspect this indicator side-by-side. Same source, same year.
VS