← All visual stories
Where the world lives
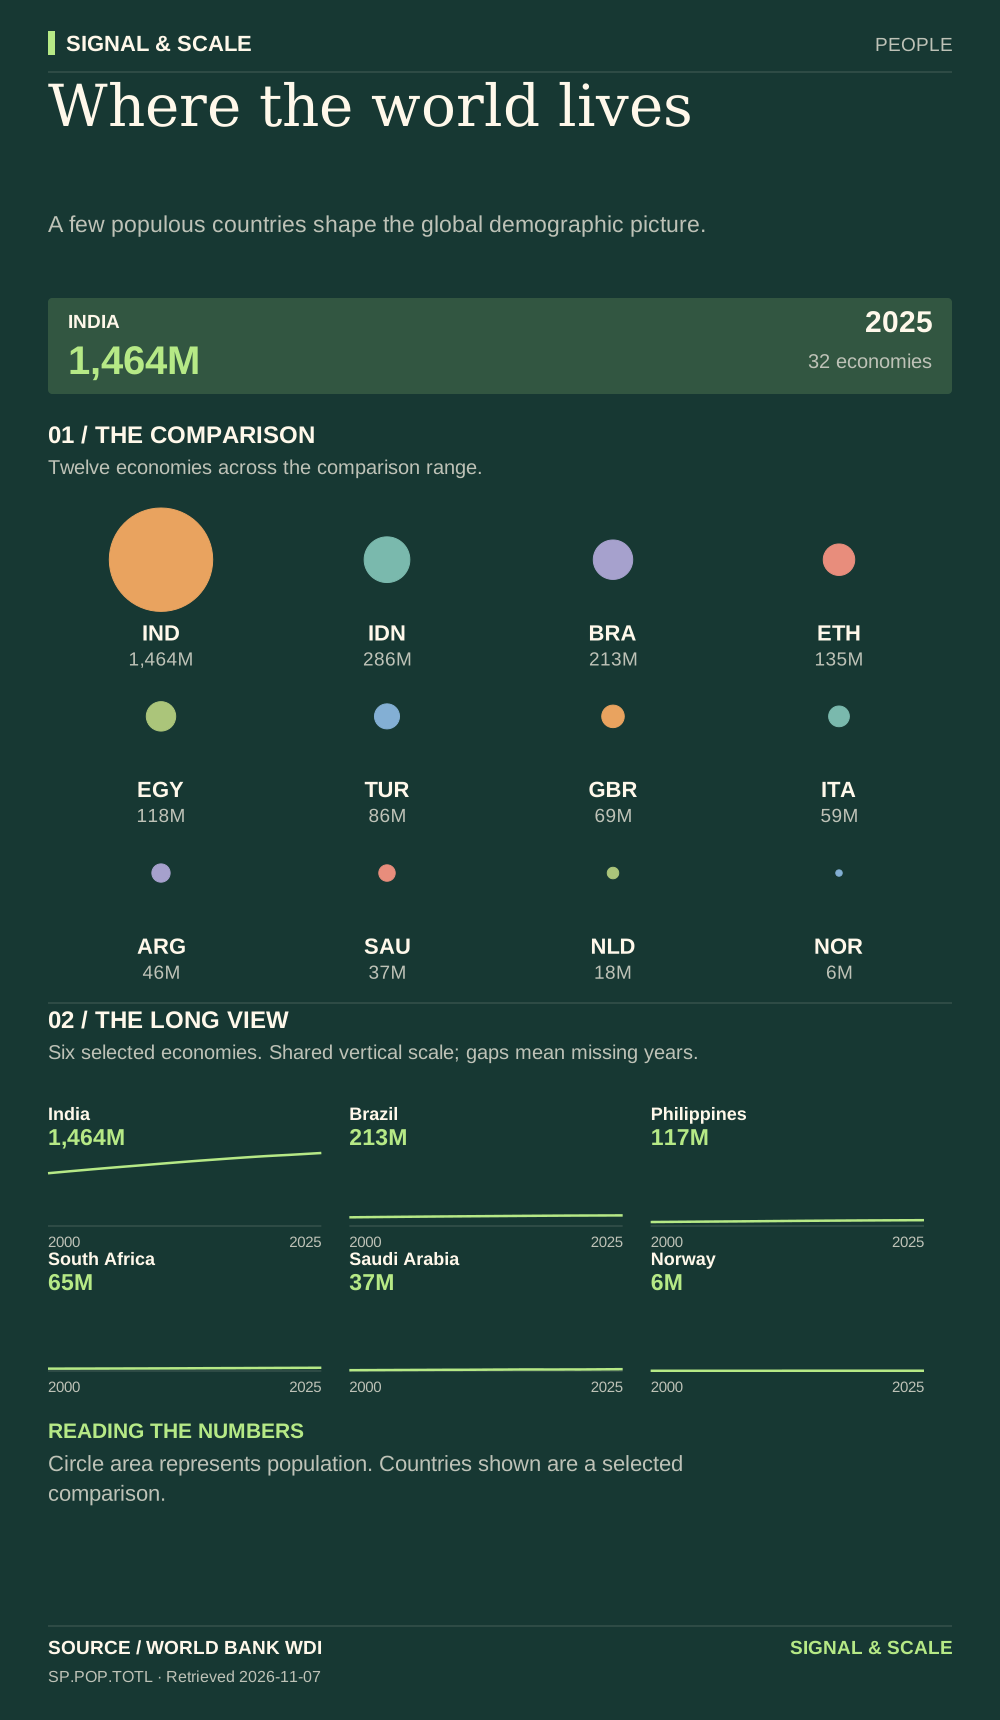
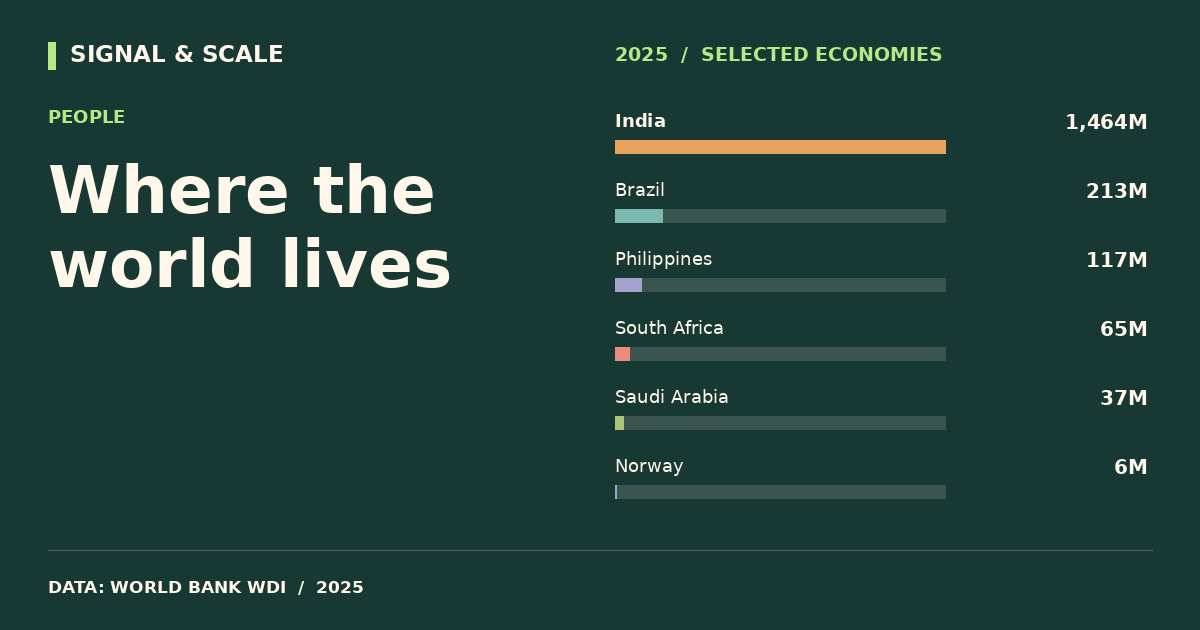
A few populous countries shape the global demographic picture.

Explore, download and share
THE STORY BEHIND THE CHART
The story behind the numbers
Population totals matter for infrastructure, education and the scale of domestic markets. Proportional circles make the differences visible without compressing every country into a narrow bar. The historical panel helps distinguish a large population from a fast-growing one.
THE TAKEAWAY
A few populous countries shape the global demographic picture.
Read the numbers carefully
Circle area represents population. Countries shown are a selected comparison.
Data behind the visual
This selected comparison includes 32 economies with observations in 2025 shown in million people.
| Country | Value |
|---|---|
| India | 1,463.9M |
| China | 1,406.6M |
| United States | 341.8M |
| Indonesia | 285.7M |
| Pakistan | 255.2M |
| Nigeria | 237.5M |
| Brazil | 212.8M |
| Bangladesh | 175.7M |
| Ethiopia | 135.5M |
| Mexico | 131.9M |
| Japan | 123.4M |
| Egypt | 118.4M |
| Philippines | 116.8M |
| Vietnam | 101.6M |
| Türkiye | 85.9M |
| Germany | 83.5M |
| Thailand | 71.6M |
| United Kingdom | 69.5M |
| France | 68.7M |
| South Africa | 64.7M |
| Italy | 58.9M |
| Kenya | 57.5M |
| South Korea | 51.7M |
| Argentina | 45.9M |
| Canada | 41.7M |
| Saudi Arabia | 37.0M |
| Poland | 36.4M |
| Australia | 27.6M |
| Netherlands | 18.1M |
| United Arab Emirates | 11.5M |
| Sweden | 10.6M |
| Norway | 5.6M |
EXPLORE THE DATA
Compare any two countries.
Choose two places to inspect this indicator side-by-side. Same source, same year.
VS