← All visual stories
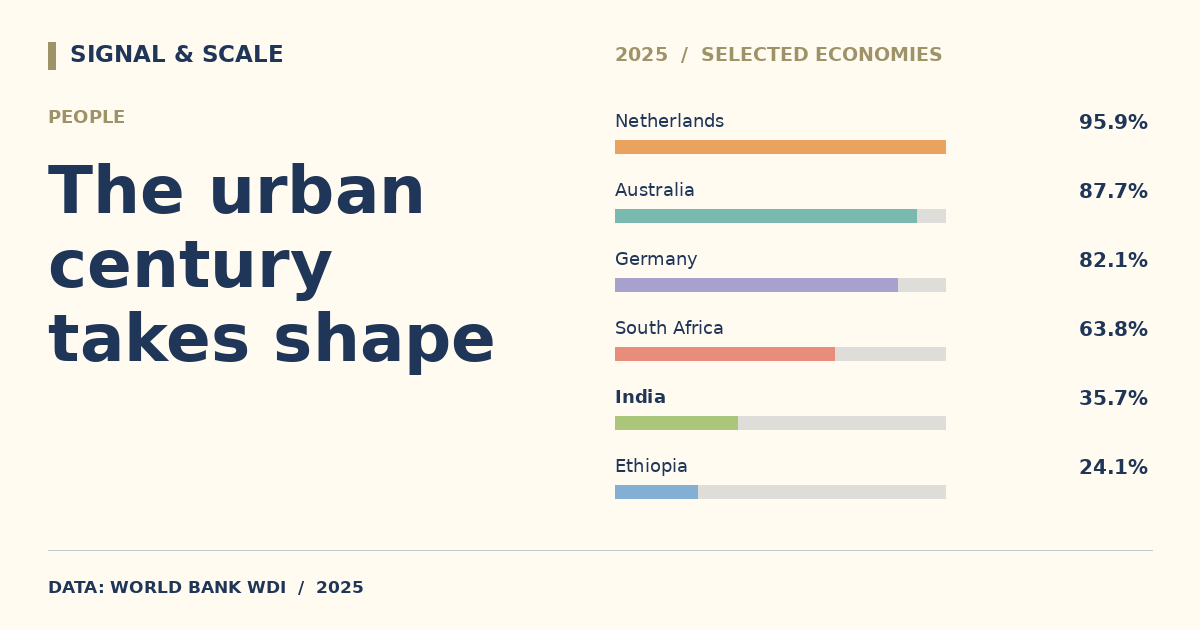
The urban century takes shape
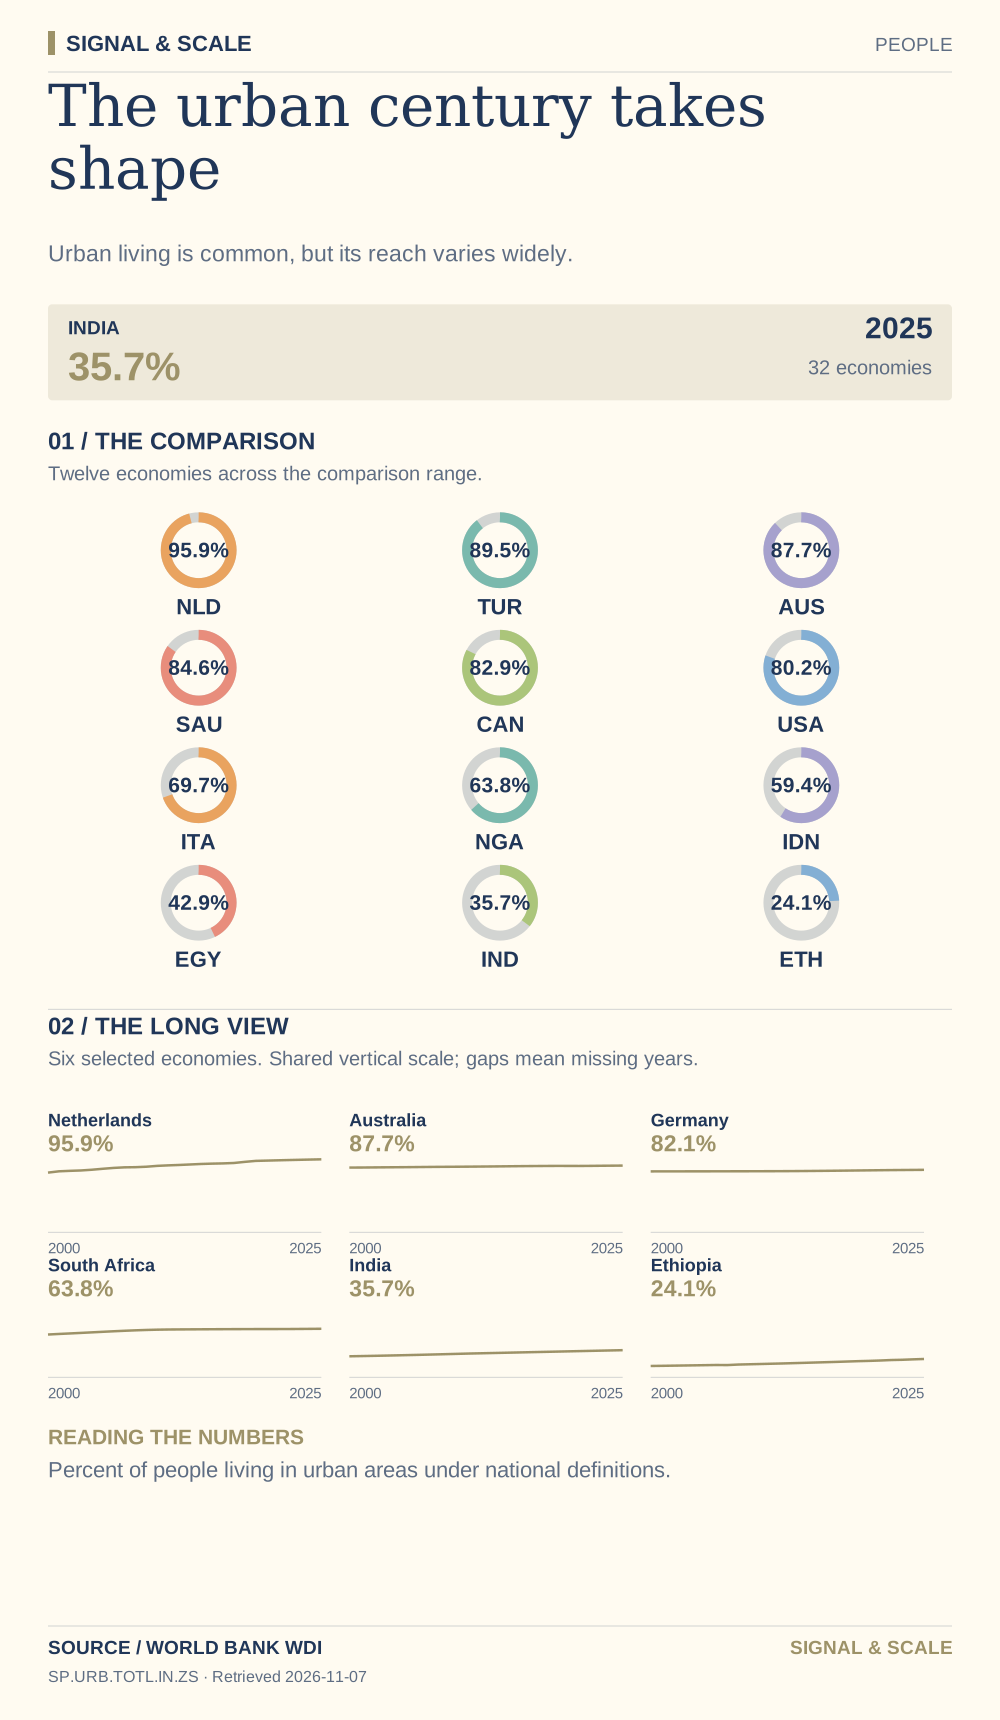
Urban living is common, but its reach varies widely.

Explore, download and share
THE STORY BEHIND THE CHART
The story behind the numbers
Urban population shares describe where people live under national definitions. The transition can change demand for housing, transport and services. Country definitions of an urban area differ, so the chart supports broad comparison rather than a perfectly uniform classification.
THE TAKEAWAY
Urban living is common, but its reach varies widely.
Read the numbers carefully
Percent of people living in urban areas under national definitions.
Data behind the visual
This selected comparison includes 32 economies with observations in 2025 shown in % of people.
| Country | Value |
|---|---|
| Netherlands | 95.9% |
| Argentina | 92.4% |
| Japan | 92.3% |
| Türkiye | 89.5% |
| Sweden | 89.1% |
| Brazil | 88.2% |
| Australia | 87.7% |
| United Arab Emirates | 86% |
| Saudi Arabia | 84.6% |
| Norway | 83.6% |
| United Kingdom | 83.3% |
| Canada | 82.9% |
| Germany | 82.1% |
| South Korea | 81.2% |
| United States | 80.2% |
| Mexico | 80% |
| France | 78.8% |
| Italy | 69.7% |
| China | 66.3% |
| South Africa | 63.8% |
| Nigeria | 63.8% |
| Thailand | 62.8% |
| Poland | 60.1% |
| Indonesia | 59.4% |
| Philippines | 55.8% |
| Egypt | 42.9% |
| Pakistan | 39.5% |
| Vietnam | 38.8% |
| India | 35.7% |
| Bangladesh | 33.2% |
| Kenya | 32.2% |
| Ethiopia | 24.1% |
EXPLORE THE DATA
Compare any two countries.
Choose two places to inspect this indicator side-by-side. Same source, same year.
VS